Power BI (https://powerbi.microsoft.com) is Microsoft’s tool that provides fast analysis and reporting to developers and business users. Microsoft releases features on a monthly basis to this tool, so this post may be out of date before it’s even published! One of the more recent releases includes the ability to create and publish custom visualizations for use by others.
Power BI Visuals Gallery
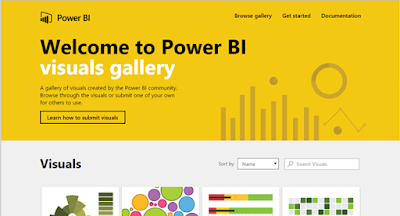
The Power BI Visuals Gallery is where you can publish, search, and download custom visuals for use in Power BI Desktop and the Power BI website. People in the community and Microsoft have published visualizations that enhance the dashboard experience and still interact with the other visualizations as though they came from out-of-the-box! (On a side note, do we need to stop saying out-of-the-box now that everything is cloud-first…) The types of visuals run the gamit from charts, graphs, animations, and slicers.
Searching for a Custom Visual
To start, go to the Power BI Visuals Gallery: https://app.powerbi.com/visuals.
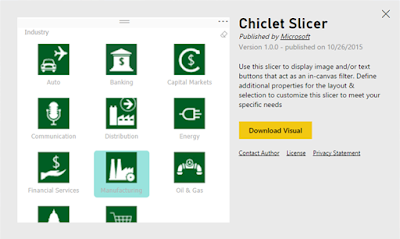
For example, Microsoft released a custom visual that handles advanced slicing, known as the Chiclet Slicer. Once you find that visual (or another that you like), click on it, and click the “Download Visual” button.
It warns you that this isn’t supported by Microsoft, but if you like living on the edge, click “I agree”. (I chuckled a little that the visualization published by Microsoft is not supported by Microsoft, but I’m not complaining - I’m just happy to have this cool tool!)
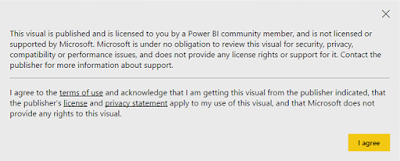
The visualization will download as a *.pbiviz (Power BI Visualization) file to your desktop.
Installing a Custom Visual
Next, you need to install the custom visualization. This shows the install process for Power BI Desktop, but the process is similar to the Power BI Website. Kick off the install through the File > Import menu or by clicking the ellipses (…) in the Visualizations pane.
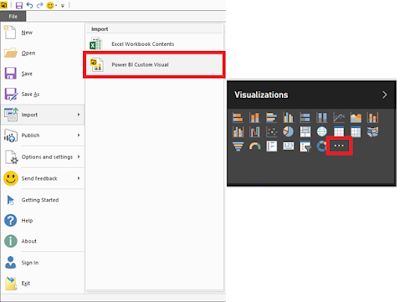
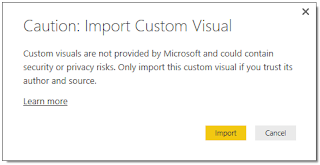
Select your downloaded .pbiviz custom visualization, and you will be warned yet again to make sure you really, really, really want to import the custom visualization. If so, click the “Import” button.
And hurray, you have installed the visual!
Verifying the Custom Visual
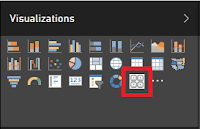
You can check to see that the visual is installed by looking at the visualization pane within Power BI Desktop. You will see the new visualization in the Visualization pane, available for your use.
When you next open the report, you will get a message warning you about custom visuals again. Just select “Enable custom visuals”, and you are all set. Happy dashboarding!
Versions: Power BI Visuals Gallery on 11/2/2015, Power BI Desktop v2.28.4190.122
Power BI Visuals Gallery
The Power BI Visuals Gallery is where you can publish, search, and download custom visuals for use in Power BI Desktop and the Power BI website. People in the community and Microsoft have published visualizations that enhance the dashboard experience and still interact with the other visualizations as though they came from out-of-the-box! (On a side note, do we need to stop saying out-of-the-box now that everything is cloud-first…) The types of visuals run the gamit from charts, graphs, animations, and slicers.
Searching for a Custom Visual
To start, go to the Power BI Visuals Gallery: https://app.powerbi.com/visuals.


It warns you that this isn’t supported by Microsoft, but if you like living on the edge, click “I agree”. (I chuckled a little that the visualization published by Microsoft is not supported by Microsoft, but I’m not complaining - I’m just happy to have this cool tool!)

The visualization will download as a *.pbiviz (Power BI Visualization) file to your desktop.
Installing a Custom Visual
Next, you need to install the custom visualization. This shows the install process for Power BI Desktop, but the process is similar to the Power BI Website. Kick off the install through the File > Import menu or by clicking the ellipses (…) in the Visualizations pane.


And hurray, you have installed the visual!
Verifying the Custom Visual
You can check to see that the visual is installed by looking at the visualization pane within Power BI Desktop. You will see the new visualization in the Visualization pane, available for your use.

When you next open the report, you will get a message warning you about custom visuals again. Just select “Enable custom visuals”, and you are all set. Happy dashboarding!
Versions: Power BI Visuals Gallery on 11/2/2015, Power BI Desktop v2.28.4190.122
Comments
Microsoft has actively sustained what they call “a blistering pace of innovation” and, whilst listening to user needs, they continue to update Power BI with monthly updates.
Microsoft Power BI is new, but excitingly it’s evolving virtually on a monthly basis. So just when you realize how brilliant the Power BI tool is, you suddenly discovered it’s just got even better!
Data Bear is one of the many companies helping clients with this powerful self-service business intelligence (BI) offering, and it didn’t take long for their team to identify Power BI as a serious game changer. Specializing in business intelligence consulting, Data Bear founder, Johann Joubert believes Power BI has become the single most powerful tool for businesses to use to ensure the full range of businesses are ahead of the rapidly changing BI world and the opportunities it offers.
Find More : Power BI Services