In a previous post, I showed how to dynamically limit the number of rows shown in a table or matrix. This methodology used a filter on the table to only show the desired number of rows. The disadvantage with this method is that all rows are returned, even if only a small subset of rows is actually desired.
To alleviate this problem, you can use a query parameter to restrict the number of rows returned at the query level. This does introduce a different problem. Every time the report is run with a different Top N parameter, the query will be rerun to bring back the correct number of rows. You will need to determine which method is optimal for your situation.
Here are the steps to create a sample report to show this new method.
1. Add a report parameter named “NumberPpl” of data type integer.
2. Create a DataSource connecting to the AdventureWorksDW database and a DataSet with the following query:
SELECT TOP(cast(@TopN as int)) DimEmployee.FirstName, DimEmployee.LastName, SUM(FactResellerSales.SalesAmount) AS SalesAmount
FROM DimEmployee INNER JOIN
FactResellerSales ON DimEmployee.EmployeeKey = FactResellerSales.EmployeeKey
WHERE (FactResellerSales.OrderDateKey = 20011001)
GROUP BY DimEmployee.FirstName, DimEmployee.LastName
ORDER BY SUM(FactResellerSales.SalesAmount) DESC
Assign the @TopN query parameter to use the @NumberPpl report parameter.
Note that this differs from the original query in two ways:
A. Includes the TOP clause to restrict the rows
B. Includes a descending order by for the SalesAmount to ensure the highest SalesAmounts are shown
Also note that the TopN query parameter is cast to an integer. This is because all query parameters are created as string and the TOP clause expects an integer.
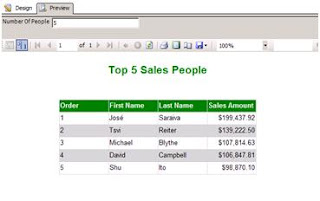
3. Add a table to the body of the report with the data fields of FirstName, LastName, and SalesAmount. Sort by the column SalesAmount from ‘Z to A’. This sort is now only for display purposes and is not necessary to return the correct data.
4. Preview the report, modifying the value for the parameter NumberPpl to see the number of rows change. It should look similar to the report below and the reports using the first method.
 Version: SQL Server 2008 RTM
Comments
I would recommend posting your question on the MSDN forum - then multiple people can help.
Best,
Jessica